

Foreigners Bought $300.7 Billion of US Securities in August, but Treasury Demand Is Fading: What TIC Data Say About 5% Yields
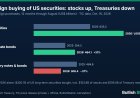
Foreign investors bought a net $300.7B of US long-term securities in August, led by stocks. Over 12 months, equity buying rose 59% while Treasury note and bond buying fell 37%.


Published October 17, 2026. Foreign investors bought a net $300.7 billion of US long-term securities in August, up from just $40.6 billion in July, according to Treasury International Capital (TIC) data released on Friday. Stocks took the biggest share, with $153.9 billion, while Treasury bonds and notes drew $109.0 billion. Over 12 months, the picture is clearer: foreign buying of US equities is up about 59%, while net purchases of Treasury notes and bonds are down about 37%, a useful backdrop to a 10-year yield above 5%.
Key takeaways
- Long-term securities: net foreign purchases of $300.7 billion in August ($257.8 billion private, $42.9 billion official), up from $40.6 billion in July. After US purchases of foreign securities, net long-term flows were $279.2 billion.
- Total TIC flows: a net inflow of $199.8 billion in August (private $178.5 billion, official $21.3 billion).
- Treasury bills: foreign holdings fell by $47.8 billion, with official institutions cutting $42.2 billion.
- 12 months to August 2026 (our calculation): net foreign purchases of US equities $1,009.6 billion (+59% on a year earlier); Treasury bonds and notes $306.4 billion (−37%).
- Next release: September data on November 18, 2026.
August in four lines
| Net foreign purchases (US$ bn) | May | June | July | August |
|---|---|---|---|---|
| All US long-term securities | 262.8 | 209.9 | 40.6 | 300.7 |
| US equities (private + official) | 134.6 | 182.6 | 3.7 | 153.9 |
| Treasury bonds and notes (private + official) | 56.6 | 6.2 | −3.6 | 109.0 |
| Treasury bills (all foreign holders) | −43.5 | −29.0 | +39.0 | −47.8 |
Source: US Treasury, TIC press release of October 16, 2026 (lines 3, 5, 8, 10, 13 and 23); private and official lines added by BullishStation. Data are not seasonally adjusted.
Our calculation: the 12-month shift from bonds to stocks
| 12 months through August (US$ bn) | 2025 | 2026 | Change |
|---|---|---|---|
| All US long-term securities, net | 1,549.5 | 1,875.9 | +21% |
| US equities, net (private + official) | 633.2 | 1,009.6 | +59% |
| Treasury bonds and notes, net (private + official) | 484.8 | 306.4 | −37% |
| Corporate bonds, net (private + official) | 354.2 | 464.1 | +31% |
| Treasury bills (all foreign holders) | 203.7 | −23.9 | reversed |
Source: TIC press release, 12-month columns; our sums and percentages.
Why it matters for yields and Bitcoin
- Treasury demand is softer than the headline. August's $109 billion in notes and bonds was strong, but over a year foreigners bought far fewer Treasuries while the US deficit stays large. The IMF now projects a US deficit of 8.5% of GDP by 2031 (see the fiscal math behind 5% yields). Less foreign demand for the same supply is one reason term premiums stay high.
- Official holders are trimming cash. Foreign official institutions reduced T-bill holdings by $99.4 billion over 12 months, a sign that some central banks are using dollar liquidity rather than adding to it.
- Risk appetite was strong in August. $153.9 billion of net foreign buying of US stocks in a single month shows global investors were adding risk in late summer, before the October risk-off phase that hit crypto and ETF flows.
- For Bitcoin: high real yields raise the opportunity cost of holding a non-yielding asset. The 10-year yield closed at 5.09% on October 16 (Treasury), after 5.21% on October 13. TIC data are two months old, so they explain the backdrop, not the daily moves.
What to watch next
- October 28: FOMC decision (see our Fed rate decisions tracker).
- Early November: Treasury quarterly refunding announcement, which sets the size of note and bond auctions.
- November 18: TIC data for September.
FAQ
What are TIC data?
Monthly Treasury statistics on cross-border flows into and out of US securities, based mainly on custodial data. They can misattribute holdings held through third countries, as the Treasury itself notes.
Did foreigners sell Treasuries in August?
No for notes and bonds (net purchases of $109.0 billion), yes for bills: holdings fell by $47.8 billion.
Why are the data from August?
TIC data are published with a lag of about six weeks. September figures are due on November 18, 2026.
Related reading: IMF sees US deficit at 8.5% of GDP · 10-year yield above 5%: what it means for Bitcoin · US import prices and industrial production · How Fed interest rates affect Bitcoin · Macroeconomics explained for crypto investors · Crypto liquidity and institutional flows guide
Sources: US Treasury, Treasury International Capital Data for August 2026 (Oct. 16, 2026) · US Treasury, daily par yield curve rates · IMF Fiscal Monitor
This article is for information only and is not investment advice. Crypto-assets are volatile and you can lose all the money you invest. Do your own research.
What's Your Reaction?
 Like
0
 Dislike
0
 Love
0
 Funny
0
 Wow
0
 Sad
0
 Angry
0











Comments (0)