

Ether Hits Its Weakest Level Against Bitcoin Since August: ETH/BTC Down 7.8% in October as ETF Outflows Reach $885M
The ETH/BTC ratio fell to 0.0296, its lowest close since August 11 and 7.8% below September 30, as US Ether ETFs lost $885.4M in 11 October sessions.

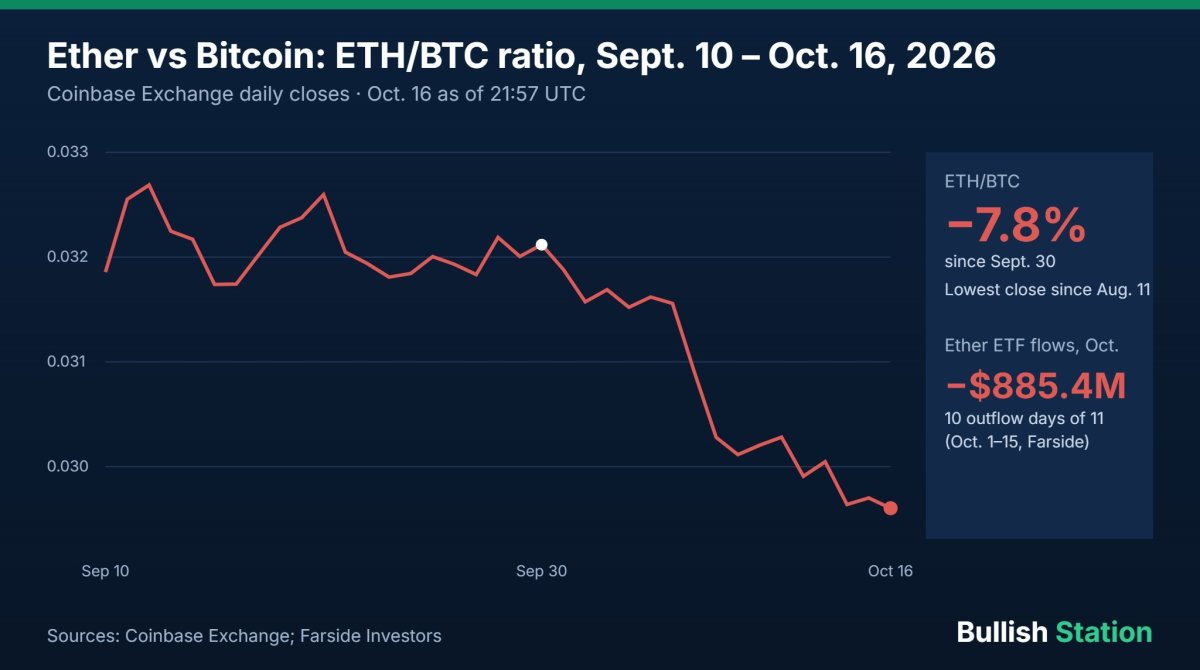
Published October 16, 2026 (data as of 21:57 UTC). Ether is losing ground against Bitcoin. The ETH/BTC ratio stood at 0.02960 on Coinbase on Friday evening, its weakest daily close since August 11 and 7.8% lower than on September 30. Over the same period, US spot Ether ETFs lost $885.4 million in 11 sessions, about 6.4% of their net inflows since launch, while Bitcoin ETFs gave back less than 1%.
Updated October 17, 2026: Farside data for Friday, October 16 show a further −$69.7 million from US spot Ether ETFs, all from BlackRock's ETHA. That makes 11 outflow days in 12 October sessions and −$955.1 million month to date. Bitcoin ETFs lost $82.4 million the same day (IBIT −$71.8M, FBTC −$10.6M).
Key takeaways
- ETH/BTC: 0.02960 on October 16, from 0.03212 on September 30 (−7.8%), 0.03391 at the end of 2025 (−12.7%) and 0.03599 a year ago (−17.7%).
- Prices in October: ETH −10.1% ($2,683.93 → $2,413.62), BTC −2.4% ($83,556 → $81,587), Coinbase daily closes.
- ETF flows in October (to Oct. 15): Ether ETFs −$885.4M with 10 outflow days out of 11; Bitcoin ETFs −$532.3M (Farside Investors).
- Relative weight: October outflows equal about 6.4% of the Ether ETFs' cumulative net inflows at the end of September, against 0.9% for Bitcoin ETFs (our calculation).
- Context: the ratio is still 14.8% above its 2026 low of 0.02578 (June 6) and 15.8% below its 2026 high of 0.03516 (January 6).
ETH/BTC in October, session by session
| Date (UTC daily close) | ETH/BTC | ETH (USD) | BTC (USD) | Ether ETF flows (US$M) |
|---|---|---|---|---|
| Sep. 30 | 0.03212 | 2,683.93 | 83,556 | −59.6 |
| Oct. 6 | 0.03156 | 2,697.28 | 85,540 | −201.9 |
| Oct. 7 | 0.03090 | 2,572.80 | 83,275 | −160.9 |
| Oct. 8 | 0.03028 | 2,472.89 | 81,693 | −72.5 |
| Oct. 13 | 0.03005 | 2,495.83 | 83,102 | +24.8 |
| Oct. 14 | 0.02964 | 2,418.66 | 81,566 | −129.5 |
| Oct. 15 | 0.02970 | 2,439.45 | 82,131 | −60.3 |
| Oct. 16 (21:57 UTC) | 0.02960 | 2,413.62 | 81,587 | not yet published |
Sources: Coinbase Exchange daily candles (ETH-BTC, ETH-USD, BTC-USD); Farside Investors (US spot Ether ETF flows, total of all funds). ETF flows are for the US trading day.
Ether ETFs vs Bitcoin ETFs: our comparison
| October 1–15, 2026 | Ether ETFs | Bitcoin ETFs |
|---|---|---|
| Net flows | −$885.4M | −$532.3M |
| Outflow days | 10 of 11 | 5 of 11 |
| Cumulative net flows since launch (Oct. 15) | $13,038M | $57,032M |
| October outflows as a share of end-September cumulative | 6.4% | 0.9% |
| Biggest October outflow | Oct. 6: −$201.9M (all ETHA) | Oct. 7: −$484.9M |
Source: Farside Investors, our calculations. BlackRock's ETHA accounts for −$726.5M of the Ether total in October.
Why ETH is lagging
- Persistent ETF selling. Ether funds have had only one inflow day in October (+$24.8M on October 13). In dollar terms the outflows are smaller than Bitcoin's on bad days, but they are much larger relative to the size of the funds.
- A risk-off backdrop. The 10-year Treasury yield has been above 5% all week (5.09% on October 16, Treasury data), and US inflation data for September came in hot. In such phases, investors usually cut higher-beta assets first, and ETH has historically been more volatile than BTC.
- No single trigger. We found no Ethereum-specific negative event in official sources this month. The move looks like a steady de-risking rather than a reaction to news.
What to watch next
- Farside flows for October 16, published after the US session: an 11th outflow day would extend the streak.
- The August low area: ETH/BTC has not closed below 0.0296 since August 11. The 2026 low is 0.02578 (June 6).
- October 28: FOMC decision, a key event for risk appetite across crypto.
- Our ETF flows tracker is updated every trading day.
FAQ
What is the ETH/BTC ratio?
It is the price of one ether expressed in bitcoin. At 0.0296, one ETH buys 0.0296 BTC. A falling ratio means ether is underperforming bitcoin, whatever the dollar price does.
How much have Ether ETFs lost in October?
$885.4 million from October 1 to 15, according to Farside Investors, with outflows on 10 of 11 trading days.
Is ETH at its lowest level of the year against BTC?
No. The 2026 low on Coinbase was 0.02578 on June 6. The current level is the weakest since August 11.
Related reading: Ether ETFs bleed for 10 straight sessions · Bitcoin and Ether ETF flows tracker · What are Bitcoin ETFs and how flows move price · Ethereum layer 1 and layer 2 explained · Ethereum's Lean roadmap · 10-year yield above 5%: what it means for Bitcoin · US import prices and industrial production in September
Sources: Coinbase Exchange, ETH-BTC · Coinbase Exchange, ETH-USD · Farside Investors, Ethereum ETF flows · Farside Investors, Bitcoin ETF flows · US Treasury, daily par yield curve rates
This article is for information only and is not investment advice. Crypto-assets are volatile and you can lose all the money you invest. Do your own research.
What's Your Reaction?
 Like
0
 Dislike
0
 Love
0
 Funny
0
 Wow
0
 Sad
0
 Angry
0













Comments (0)