

US Import Prices Post Biggest Annual Rise Since 2022 as Industrial Output Jumps 0.7%: What It Means for the Fed and Bitcoin
US import prices rose 1.1% in September and 8.1% over a year, the most since July 2022. Industrial production rose 0.7%, led by a 3.5% jump in utilities.

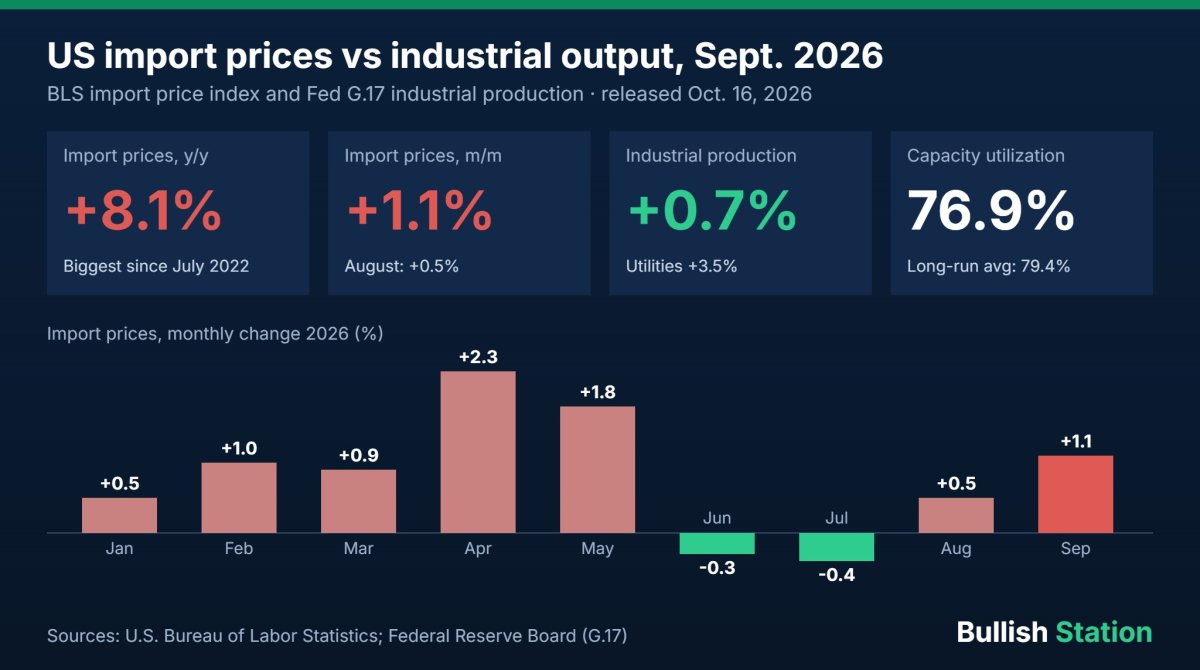
Published October 16, 2026. Two US releases on Friday added to the picture of an economy running hot on energy. US import prices rose 1.1% in September and 8.1% over 12 months, the largest annual increase since July 2022, the Bureau of Labor Statistics said. Forty-five minutes later, the Federal Reserve reported that industrial production rose 0.7%, its strongest month since April, driven by a 3.5% jump in utilities output. Bitcoin barely moved, and the 10-year Treasury yield edged down to 5.09%.
Key takeaways
- Import prices: +1.1% month on month (August revised to +0.5%) and +8.1% year on year. Fuel imports: +4.8% on the month and +34.5% on the year. Nonfuel imports: +0.7% and +6.0%, their biggest annual rise since April 2022.
- Export prices: +2.2% on the month and +11.6% on the year, the largest annual gain since July 2022.
- Industrial production: +0.7% in September after +0.1% in August (revised up from 0.0%), +2.2% on the year and +2.8% at an annual rate in the third quarter.
- Composition: utilities +3.5%, manufacturing +0.3%, mining +0.2%. Motor vehicles and parts fell 3.0%.
- Capacity utilization: 76.9%, up from 76.4%, but still 2.5 points below its 1972–2025 average of 79.4%.
- Markets: Bitcoin traded near $81,940 at 13:00 UTC, just after the data, and at $81,559 at 21:57 UTC (Coinbase), down about 0.5%. The 10-year yield closed at 5.09%, from 5.21% on Tuesday (Treasury).
Import prices: the energy shock is now in the pipeline
| BLS import/export price index (Sep. 2026) | Month on month | Year on year |
|---|---|---|
| All imports | +1.1% | +8.1% |
| Fuel imports | +4.8% | +34.5% |
| Import petroleum and products | +4.6% | +35.4% |
| Import natural gas | +1.6% | +96.5% |
| Nonfuel imports | +0.7% | +6.0% |
| Imports from China | +0.7% | +3.1% |
| All exports | +2.2% | +11.6% |
| Agricultural exports | +2.6% | +9.0% |
Source: BLS, U.S. Import and Export Price Indexes, September 2026 (USDL-26-1577), Table A and text. Import prices are measured before tariffs.
Our calculation: 2026 month by month
| 2026 | Jan | Feb | Mar | Apr | May | Jun | Jul | Aug | Sep |
|---|---|---|---|---|---|---|---|---|---|
| All imports, m/m | +0.5 | +1.0 | +0.9 | +2.3 | +1.8 | −0.3 | −0.4 | +0.5 | +1.1 |
| Fuel imports, m/m | −1.2 | +2.5 | +10.2 | +18.9 | +12.1 | −3.7 | −6.8 | −0.2 | +4.8 |
| Nonfuel imports, m/m | +0.7 | +0.8 | +0.2 | +0.9 | +0.7 | +0.1 | +0.3 | +0.6 | +0.7 |
Chained together, the nine monthly changes give about +7.6% for all imports since December 2025, and about +5.1% for nonfuel imports (our calculation from BLS monthly changes; rounding can move the result by a few tenths). The point: nonfuel import prices have not fallen in a single month since August 2025, so the rise is no longer only about oil.
Industrial production: utilities did the heavy lifting
| Fed G.17 (Sep. 2026, preliminary) | Month on month | Year on year | Capacity utilization |
|---|---|---|---|
| Total industry | +0.7% | +2.2% | 76.9% |
| Manufacturing | +0.3% | +1.1% | 75.9% |
| Mining | +0.2% | +2.8% | 87.5% |
| Utilities | +3.5% | +8.7% | 73.8% |
| Business equipment | 0.0% | +6.7% | – |
| Consumer goods | +0.7% | −0.1% | – |
Source: Federal Reserve Board, G.17 release of October 16, 2026, summary table. In the third quarter, durable manufacturing rose at a 3.8% annual rate, helped by a 28.4% gain in semiconductors and related components, while nondurable manufacturing fell 1.6%.
Why it matters for the Fed and Bitcoin
- Price pressure upstream. September now has a full set of hot price data: CPI at 3.7% year on year, producer prices up 1.3% in one month, and import prices up 8.1% over 12 months. Higher import costs tend to reach consumer prices with a lag, which keeps pressure on a Fed that raised rates in September.
- Output is firm, not booming. Excluding the weather- and energy-driven utilities jump, manufacturing grew only 0.3%, and capacity utilization remains well below its long-run average. That is not the profile of an overheating factory sector.
- Markets shrugged. The 10-year yield fell for a third day to 5.09%, and Bitcoin ended the US session about 0.5% below its post-release level. For crypto, the bigger drivers this week were ETF flows and the risk-off mood, not this data.
- The Fed stays quiet. Chair Kevin Warsh said at the IMF meetings that he does not "prejudge meetings" (as reported by Axios; no official transcript yet). The FOMC blackout period starts on Saturday, October 17.
What to watch next
- October 27–28: FOMC meeting; decision on October 28 at 2 p.m. ET. Our Fed rate decisions tracker will be updated the same day.
- November 10: October CPI, 8:30 a.m. ET.
- November 17: October import and export prices (BLS), 8:30 a.m. ET.
- November 24: annual revision of industrial production, with a new 2022 base year (Fed).
FAQ
Why did US import prices rise so much?
Mostly energy: fuel import prices are up 34.5% from a year earlier and natural gas import prices almost doubled (+96.5%). But nonfuel imports also rose 6.0%, the most since April 2022.
Do import prices include tariffs?
No. The BLS import price index measures prices before duties are paid, so tariffs come on top of these increases.
Was the 0.7% rise in industrial production broad?
Not really. Utilities output jumped 3.5%, while manufacturing rose 0.3% and motor vehicle output fell 3.0%.
How did Bitcoin react?
Very little. On Coinbase, BTC was near $81,940 just after the releases and $81,559 in the evening, a move of about −0.5%.
Latest data: TIC data: foreigners bought $300.7 billion of US securities in August as Treasury demand fades (Oct. 17, 2026)
Related reading: US producer prices jump 1.3% in September · US CPI at 3.7% in September · Retail sales: gasoline did 71% of the work · CPI and crypto tracker · How Fed interest rates affect Bitcoin · The fiscal math behind 5% Treasury yields · Macroeconomics explained for crypto investors
Sources: BLS, U.S. Import and Export Price Indexes – September 2026 · Federal Reserve, G.17 Industrial Production and Capacity Utilization (Oct. 16, 2026) · US Treasury, daily par yield curve rates · Coinbase Exchange, BTC-USD · IMF, fireside chat with Fed Chair Kevin Warsh · Axios (Warsh quote)
This article is for information only and is not investment advice. Crypto-assets are volatile and you can lose all the money you invest. Do your own research.
What's Your Reaction?
 Like
0
 Dislike
0
 Love
0
 Funny
0
 Wow
0
 Sad
0
 Angry
0











Comments (0)